
Hacking My Traeger Grill


As a southerner, I love BBQ and smoking meats, and the Traeger is no muss no fuss. However, I'm also a nerd that loves doing things in my homelab. It started out early one morning after putting a beautiful pork butt on the smoker for some pulled pork. I went back in the house and was trying to think of something to do while it got started... and thus was born the idea to see what I could make with data from my Traeger Ironwood XL.
Today I'll show you how I was able to hack my Traeger grill to capture data such as the grill temperature, pellet level, probe goal, and more, as well as feed that data to a database and visualize with a Grafana dashboard all within my own homelab.
1. Information Gathering / Network Scanning
The first step in any hacking exercise is to gather as much information as possible to understand the target and what makes it tick. I'll break this down into 2 simple goals initially:
Identify the grill's IP address
Scan the grill for open ports and software versions
I was able to find the IP address of my grill easily by visiting my router, or gateway, web UI (commonly located at http://192.168.1.1) and viewing the attached devices, which listed the Traeger grill quite obviously: 192.168.1.19. Nice, moving on.
Next, I used nmap to scan for open ports and version info:
nmap -sV -p 1-9999 192.168.1.19I didn't find anything open :(
Doing some searching about Traeger's data protocols online I found a customer success story on AWS about how Traeger migrated to use AWS IoT, which uses MQTT (Message Queuing Telemetry Transport).
2. Intercepting Data from the Grill
Knowing the grill likely uses AWS, it would explain why I couldn't find any open ports on it. I often use the Traeger mobile app to monitor and control my smoker while cooking, so the mobile app is most likely talking to a server in AWS, and so is the grill.
I wanted to test this theory using a Man-in-the-Middle (MITM) proxy. Essentially we just run a proxy to capture all HTTP(S) traffic and then configure our device (mobile phone or PC) to use the proxy. You could do this using mitmproxy on one machine and then configure the mobile phone to use the proxy.
I noticed there was also a desktop Traeger app for Mac OS so I opted to try that just so I could stay on one device for my testing. So I installed the Traeger app for Mac OS, fired up Wireshark and began capturing packets on my Mac's wireless network interface en0 . While that's running, I signed in on the Traeger app and clicked around a few times to give it enough changes to fire off requests, then stopped the packet capture in Wireshark. With some luck you can find DNS requests like these:
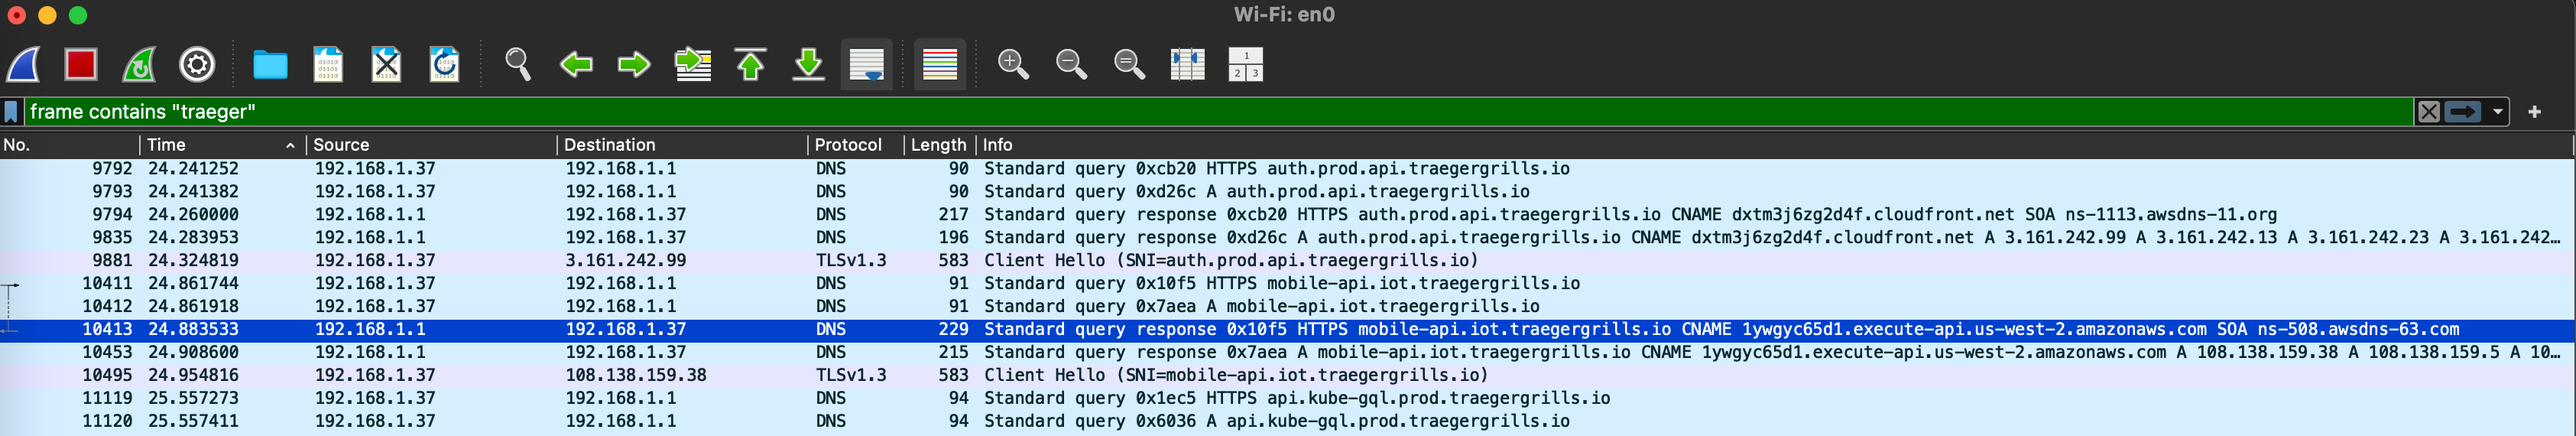
The app resolves the DNS record mobile-api.iot.traegergrills.io which is a CNAME record resolving to 1ywgyc65d1.execute-api.us-west-2.amazonaws.com. This appears to be an API gateway based on the format of the inner domain name.
With some more sniffing, I discovered the following pieces of information:
The app makes API calls to an API Gateway
mobile-api.iot.traegergrills.io.The API calls have a Bearer authentication token in the
Authorizationheader.Upon decoding that auth token with https://jwt.io it appeared to be generated by AWS Cognito because the token payload has
"iss": "https://cognito-idp.us-west-2.amazonaws.com/us-west-2_..."in it.There are API requests to endpoints such as
/prod/mqtt-connections, confirming the app does use MQTT.
This all makes sense if the folks over at Traeger are using AWS and the AWS IoT service.
3. Calling the APIs
Now that we know how the app works, we should be able to write a script that emulates the app's behavior, and therefore access data from our grill programmatically.
Fortunately I found someone else has done this as well and written a Python script to integrate Traeger with HomeAssistant: https://github.com/sebirdman/traeger/blob/master/traeger.py
With some minor tweaks I was able to reuse this code and see data pretty quickly:
❯ python -i traeger.py
>>> t = traeger('MY_EMAIL@EXAMPLE.COM', 'CHANGEME_PASSWORD', requests)
>>> t.get_user_data()
{'userId': 'REDACTED', 'givenName': 'Zach', 'familyName': 'King', 'fullName': 'Zach King', 'email': 'REDACTED', 'username': 'REDACTED', 'cognito': 'REDACTED', 'urbanAirshipId': 'REDACTED', 'teams': [{'teamId': 'REDACTED', 'teamName': 'REDACTED', 'thingName': 'REDACTED', 'userId': '3d8477eb-0605-4f47-a8fc-44580b9de96d'}], 'things': [{'thingName': 'REDACTED', 'friendlyName': 'Sir-Ribs-A-Lot', 'deviceTypeId': '2205', 'userId': '3d8477eb-0605-4f47-a8fc-44580b9de96d', 'status': 'CONFIRMED', 'productId': '53059272-02e0-4c00-914e-83f0e65edb16'}]}
>>>
Then subscribe to updates from the MQTT broker:
>>> t.refresh_mqtt_url()
>>> t.subscribe_to_grill_status()
>>> t.grill_status
{'REDACTED': {'thingName': 'REDACTED', 'jobs': [{'jobId': 'Yos_Combined_IronwoodXL_REDACTED', 'thingName': 'REDACTED', 'currentStatus': {'status': 'REJECTED', 'timestamp': 1710372539}, 'isFinished': True, 'isInProgress': False}], 'status': {'acc': [], 'ambient': 99, 'connected': False, 'cook_id': '', 'cook_timer_complete': 0, 'cook_timer_end': 0, 'cook_timer_start': 0, 'current_cycle': 0, 'current_step': 0, 'errors': 0, 'grease_level': 0, 'grease_temperature': 0, 'grill': 147, 'grill_mode': 0, 'in_custom': 0, 'keepwarm': 0, 'pellet_level': 25, 'real_time': 0, 'seasoned': 1, 'server_status': 1, 'set': 325, 'smoke': 0, 'sys_timer_complete': 1, 'sys_timer_end': 0, 'sys_timer_start': 0, 'system_status': 99, 'time': 1728263173, 'ui': {'ambient_light': 0, 'screen_brightness': 0}, 'units': 1, 'uuid': 'FC0FE708F7DF', 'probe_con': 0, 'probe': 0, 'probe_set': 0, 'probe_alarm_fired': 0}, 'features': {'cold_smoke_enabled': 0, 'flame_sensor_enabled': 1, 'grease_sensor_enabled': 0, 'grill_light_enabled': 1, 'grill_mode_enabled': 0, 'lid_sensor_enabled': 1, 'limits': {'max_grill_temp': 500}, 'open_loop_mode_enabled': 0, 'pellet_sensor_connected': 1, 'pellet_sensor_enabled': 1, 'pizza_mode_enabled': 0, 'super_smoke_enabled': 1, 'ui': {'ui_type': 0}}, 'limits': {'max_grill_temp': 0}, 'settings': {'config_version': '2205.001', 'device_type_id': 2205, 'feature': 0, 'fw_build_num': 'c0321c9d-20230221_113102', 'fw_version': '01.03.21', 'language': 0, 'networking_fw_version': '1.4.2', 'rssi': -68, 'speaker': 1, 'ssid': 'REDACTED', 'ui_fw_build_num': 'e4ea0a2-20220715_205356', 'ui_fw_version': '01.03.12', 'units': 1}, 'usage': {'ac_ignitor': 10740, 'auger': 231583, 'cook_cycles': 18, 'dc_ignitor': 0, 'error_stats': {'auger_disco': 0, 'auger_ovrcur': 0, 'bad_thermocouple': 0, 'fan_disco': 0, 'ign_ac_disco': 0, 'ign_dc_disco': 0, 'ignite_fail': 0, 'low_ambient': 0, 'lowtemp': 0, 'overheat': 0}, 'fan': 329530, 'grease_trap_clean_countdown': 0, 'grill_clean_countdown': 0, 'hotrod': 0, 'light': 8494, 'runtime': 329711, 'time': 0, 'ui': {'screen_on': 0}}, 'custom_cook': {'cook_cycles': [{'slot_num': 4, 'populated': 0}]}, 'details': {'thingName': 'REDACTED', 'userId': '3d8477eb-0605-4f47-a8fc-44580b9de96d', 'lastConnectedOn': 1728240177, 'thingNameLower': 'fc0fe708f7df', 'friendlyName': 'Sir-Ribs-A-Lot', 'deviceType': '2205'}, 'stateIndex': 33112, 'schemaVersion': '2.0'}}
>>>
4. Sending the Data to Elasticsearch
Now we need to persist the data so we can later do some visualizations in Grafana. I chose Elasticsearch so let's modify the def __init__() constructor to initialize a connection to the database:
def __init__(self, username, password, request_library, es_host):
	# Initialize Elasticsearch connection
	self.es_client = Elasticsearch([es_host])
	...
Then once the MQTT subscription is made, any time events come in from the grill, the grill_message(…) method will be invoked. So that's our hook we need to write to the database from:
def grill_message(self, client, userdata, message):
	if message.topic.startswith("prod/thing/update/"):
		grill_id = message.topic[len("prod/thing/update/"):]

		# Parse the grill status from the message
		grill_data = json.loads(message.payload)
		self.grill_status[grill_id] = grill_data

		# Add a timestamp for Elasticsearch (Grafana uses this for time-series queries)
		grill_data['timestamp'] = datetime.utcnow().isoformat()

		# Write the parsed data to Elasticsearch
		try:
			self.es_client.index(index='grill_status', id=grill_id, body=grill_data)
			logging.info(f"Grill data for {grill_id} written to Elasticsearch successfully.")
		except Exception as e:
			logging.error(f"Failed to write grill data to Elasticsearch: {e}")

		# Trigger any callbacks registered for this grill ID
		if grill_id in self.grill_callbacks:
			for callback in self.grill_callbacks[grill_id]:
				callback()
5. Visualizing the Data
Finally, we can use our data from Elasticsearch as a data source in Grafana and create a dashboard to put it all together.
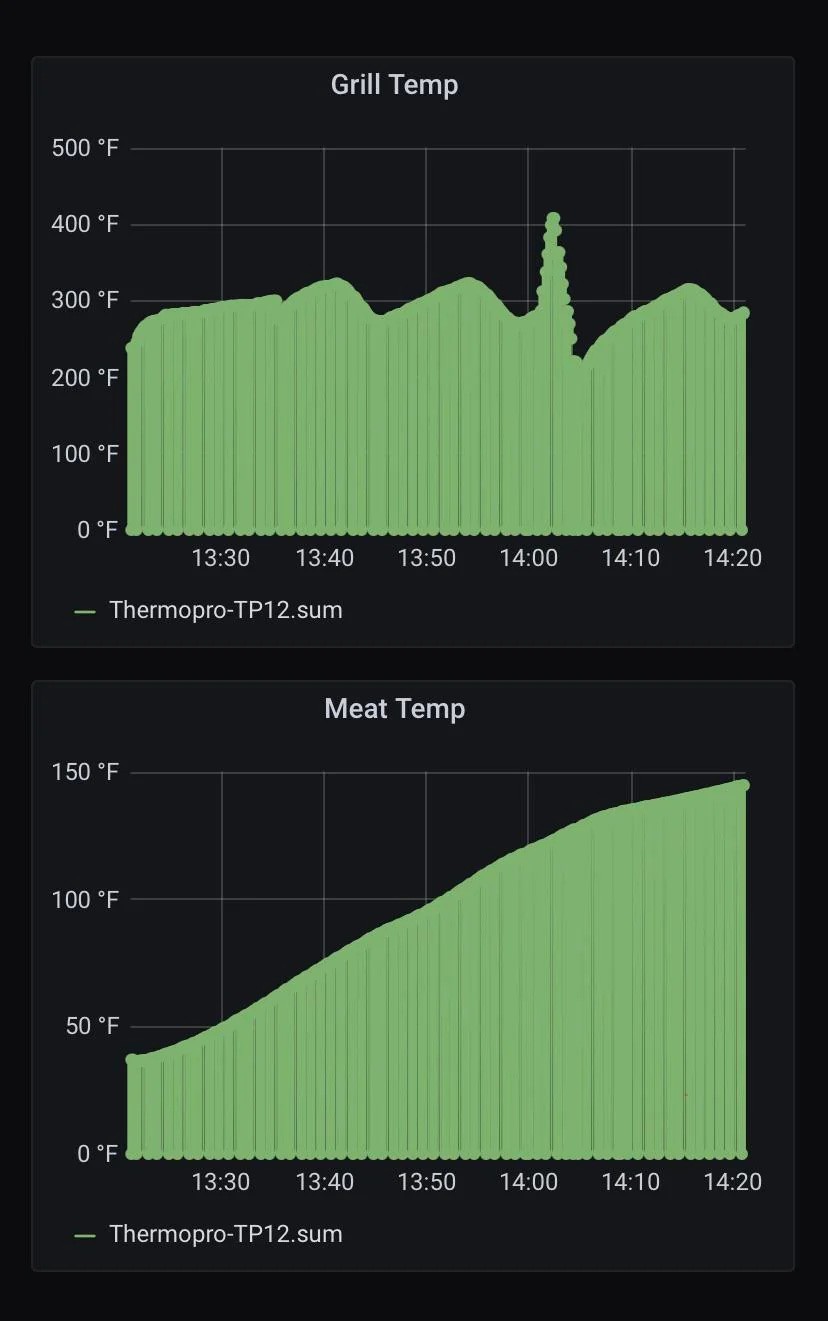
I haven't gotten to this quite yet, it's on my TODO list while migrating part of my homelab to a Kubernetes cluster running on mini-PCs (follow my newsletter and let me know if you're interested in a series on building that homelab!). However, the dashboard should contain some graphs such as grill temperature, probe 1 temperature, and probe 2 temperature. It should also contain a gauge indicating the remaining pellet level from 0-100%, and a few single stat indicators for Super Smoke mode, probe goals, and more depending on the specific grill features.
The following is a basic example to illustrate the idea (credit: user/natty_patty from the r/homelab subreddit):
Conclusion
This was a fun dive into IoT apps and learning how yet another device around the house works. You may be surprised what you find simply by scanning your network and investigating API calls.
I hope you found this useful or at least entertaining. Please consider sharing and following my newsletter if you like this content as it motivates me to write more! Let me know in the comments if you have an interesting IoT data story, what challenges did you face?